◎
Company overview
What the business does, which sector it's in, and its headline numbers: market cap, P/E, dividend yield and 52-week range.
Understand a company in 10 minutes. Each report covers what the business does, its latest results and news, the strongest bull and bear cases, and the risks to watch. Then follow it, and we'll email you when it announces something that matters.
No credit card. Read every report in the library, create 3 new ones and follow 3 companies free.
A look inside
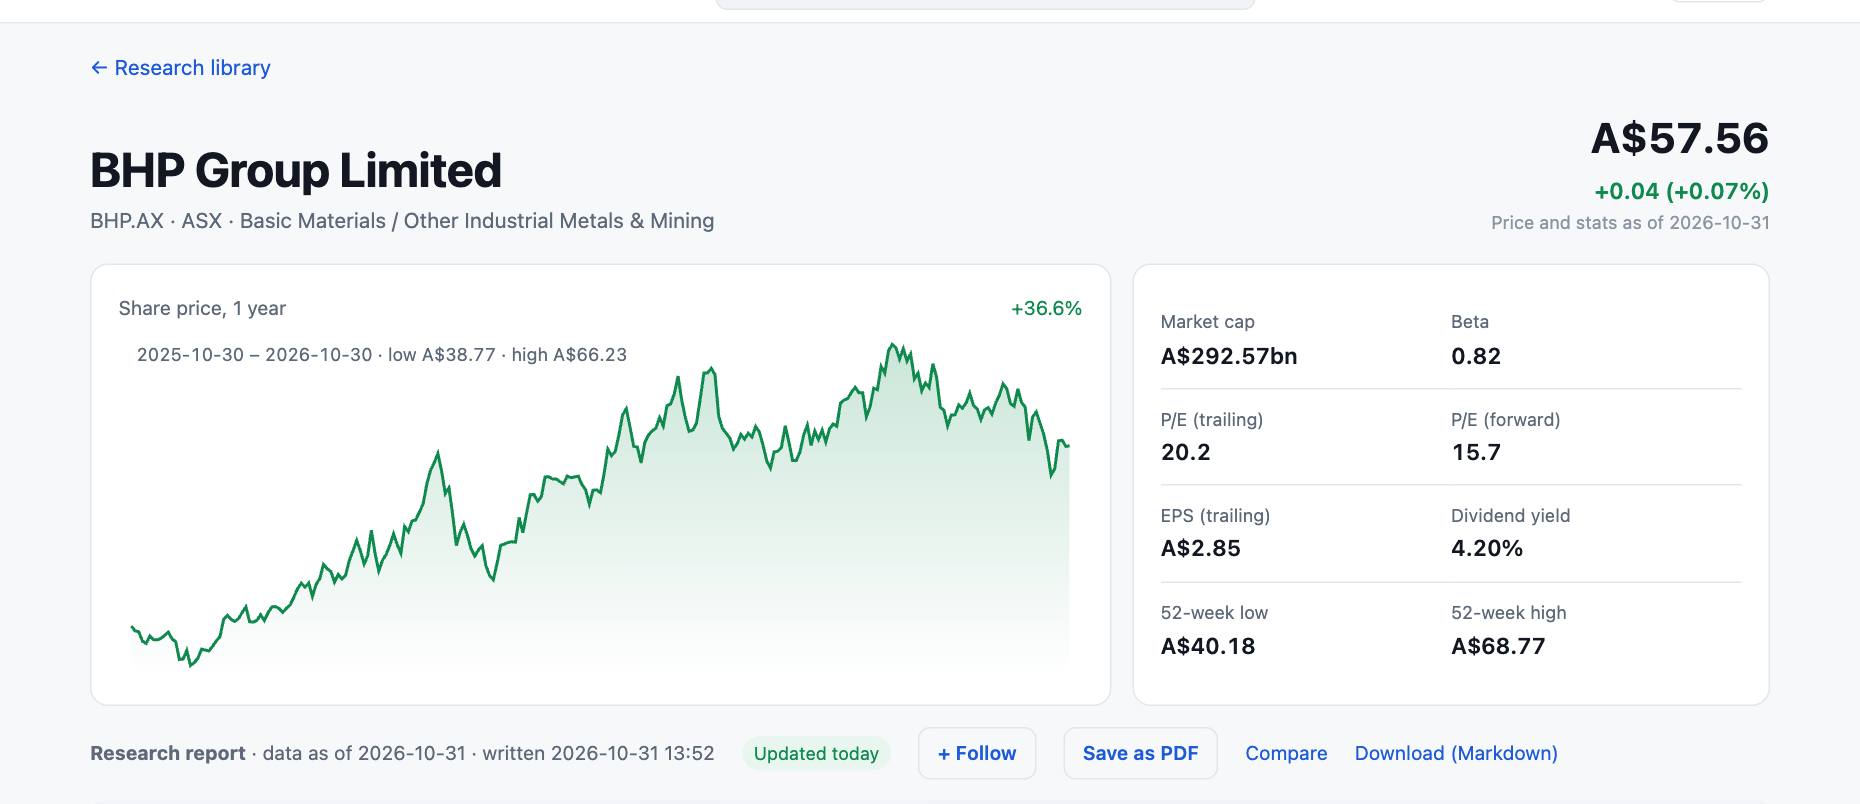
This is the report on BHP Group as it appears in the app: a one-year price chart and the key numbers up top, then the research below.
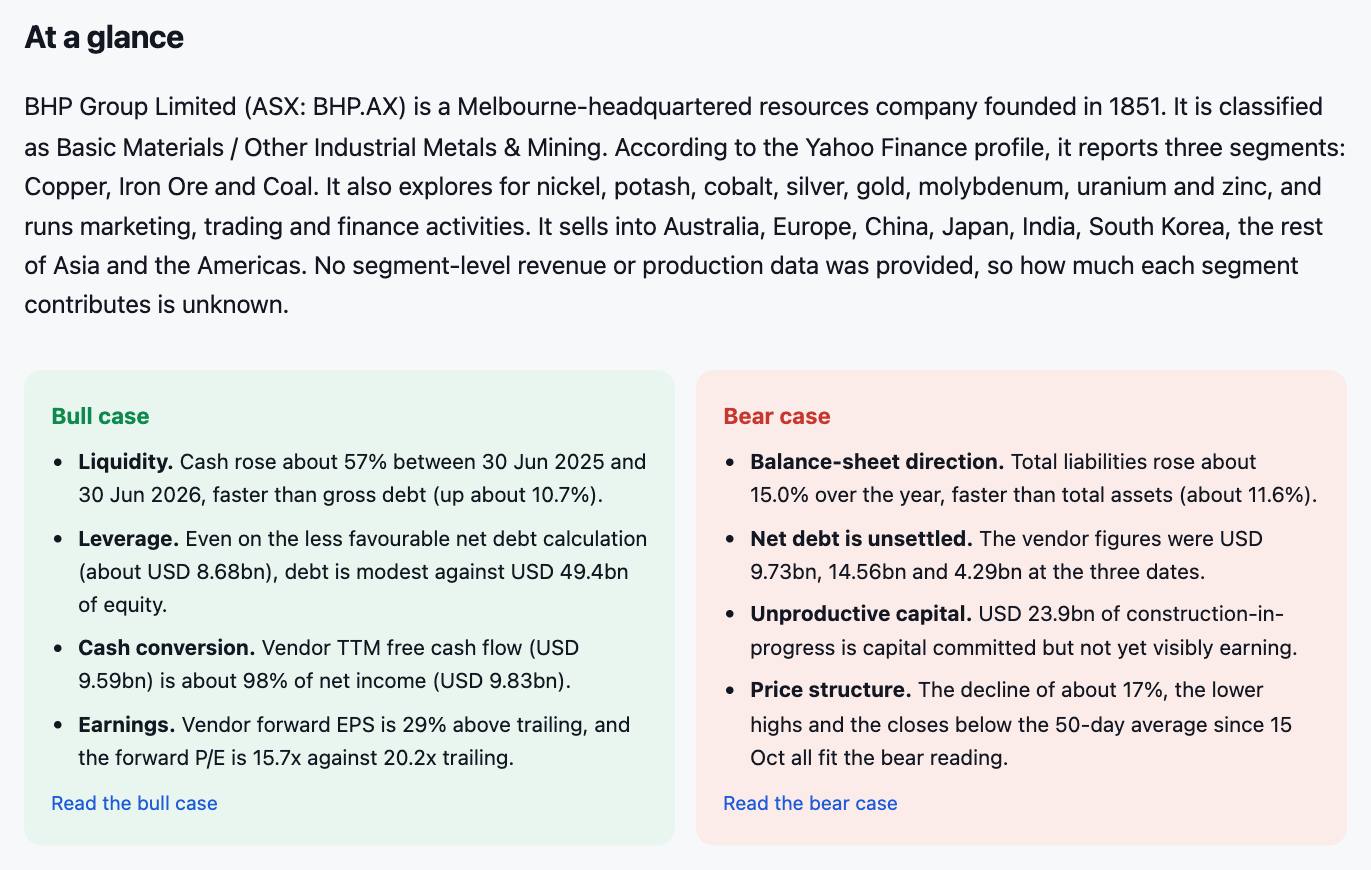
A plain-English overview, then the strongest points on each side, each one backed by a dated figure.
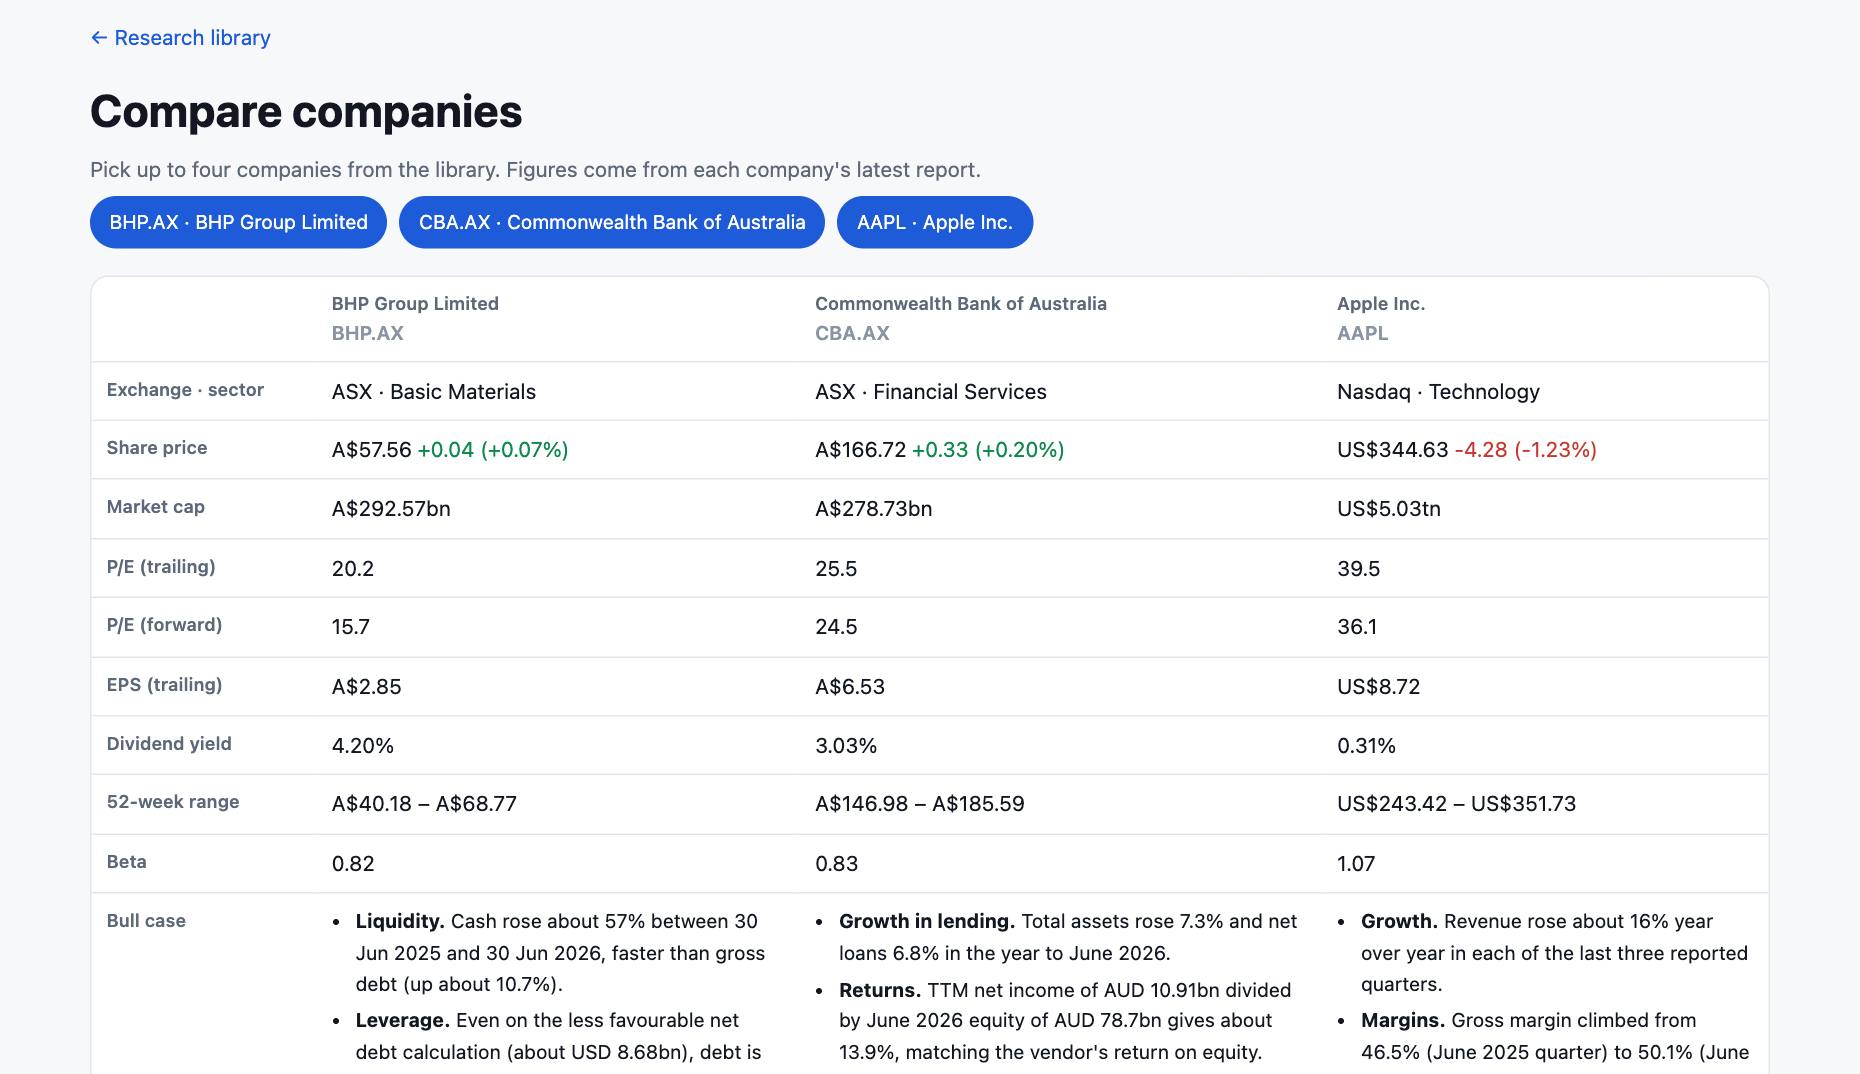
Put companies next to each other, across markets, with the same numbers in the same place.
The same lens on every company: one structure, so you can compare businesses quickly and know where to look.
What the business does, which sector it's in, and its headline numbers: market cap, P/E, dividend yield and 52-week range.
Revenue, margins, cash flow and the balance sheet from company filings, plus the news that moved the shares, all dated.
Two AI researchers argue each side from the same evidence. You see the strongest points for and against.
The specific risks to understand, most material first: competition, debt, regulation and market conditions.
Upcoming results, announcements and metrics that would change the picture.
Every report says what it couldn't verify and where sources disagree, instead of filling gaps with guesses.
Company alerts
Your followed companies are checked every hour. When one publishes something material, you get an email and a change report that explains it with evidence, not a bare headline.
ASX announcements and SEC filings, straight from the source, for every company you follow.
Price-sensitive announcements, results and major filings. Routine notices and director share trades are left out.
What happened, what changed since the last report, the evidence, and how it affects the bull and bear cases.
Coverage
Australian and US companies get the same structure, with figures in their own currency, so a miner in Melbourne and a tech company in California read side by side.

Banks, miners, healthcare and more, priced in Australian dollars.

Large and mid-size US companies, with SEC filings, in US dollars.

How it works
Reports already in the library open instantly. A company that isn't covered yet takes about 3 minutes.
Type a company name or an ASX or US ticker, like BHP.AX, CBA.AX or AAPL.
They gather prices, filings and news, then argue the bull and bear cases.
A clear summary up top, the full analysis below. Save it as a PDF or download it as Markdown.
Who it's for
Most stock tools hand you a score or a buy/sell rating. We show you both sides of the argument and the evidence behind them, and leave the decision to you.
Get up to speed on a company before you read the annual report or the news.
A fast first pass on a name you don't cover, with the figures dated so you can check them.

Sign up with Google or your email. Reading reports is unlimited, and every account can create 3 new company reports and follow 3 companies.
Yes. A free account lets you read every report in the library, create up to 3 new company reports and follow up to 3 companies. No credit card is needed.
No. Reports are general information only. They contain no ratings, price targets or recommendations, and they don't consider your objectives, financial situation or needs.
Companies listed on the ASX and US exchanges. Search by ticker, for example BHP.AX, CBA.AX or AAPL.
We check ASX announcements and SEC filings every hour. When a company you follow publishes something material, such as results, guidance or a major deal, you get an email and a change report: what happened, what changed since the last report, the evidence, and the impact on the bull and bear cases.
AI research agents gather market data, company filings and news, argue the bull and bear cases, and an AI editor writes the summary. Reports are not reviewed by a person, so check important figures against primary sources.
Every report shows the date its data is from. Reports older than a week can be updated with a new report.
Create an account in seconds with Google or email.
Sign up free Open the app